Time and motion
Who is delivering a lot for the hours they put in, and who is putting in hours with little to show?
Time and motion (/reports/time-motion), titled “Time & Motion” on screen. Whole calendar months, chosen with the month chips or the month box.
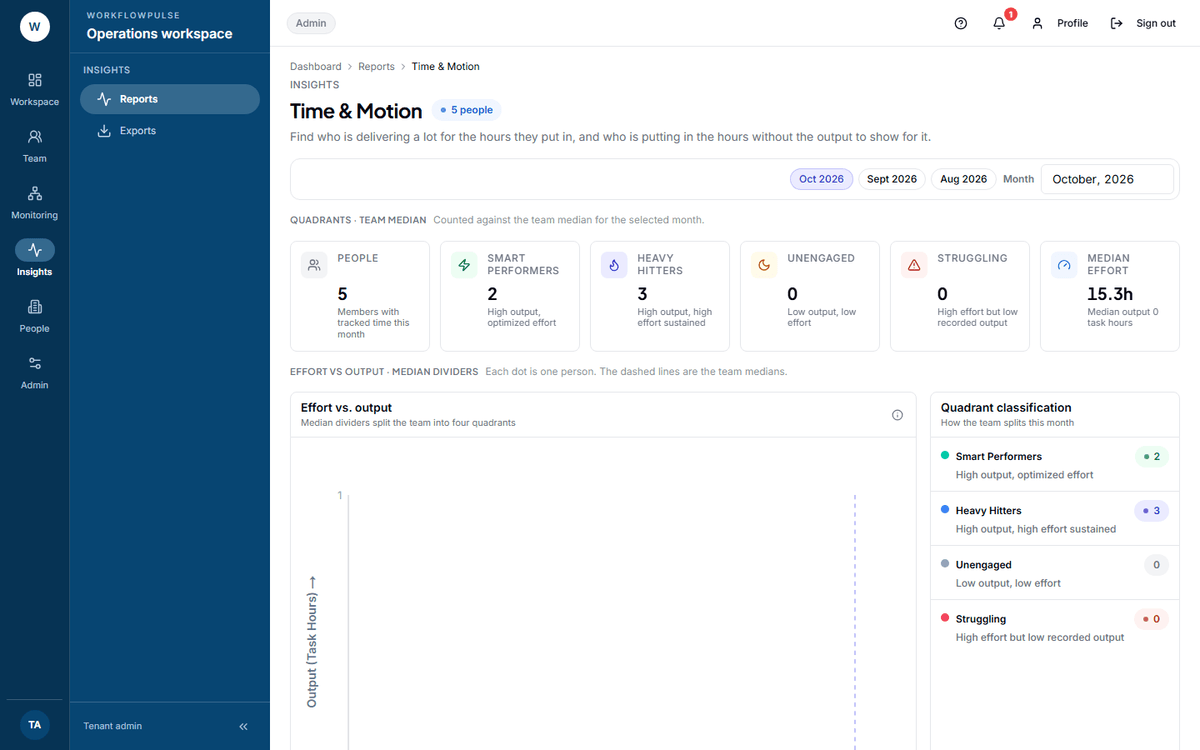 The two dashed lines are the team’s own medians, not targets. That one fact decides whether this chart is useful or harmful, so it is worth saying before anybody sees the picture.
What question it answers
Section titled “What question it answers”Who is delivering a lot for the hours they put in — and who is putting in the hours without the output to show for it.
Where the numbers come from
Section titled “Where the numbers come from”Two measures per person for the chosen month:
- Effort — active hours, which is tracked time minus idle.
- Output — task hours delivered.
The chart takes the median of each across the people on screen and draws them as dashed lines. Every person is a dot. The two lines cut the chart into four.
| Quadrant | Output | Effort | The screen’s own hint |
|---|---|---|---|
| Smart Performers | High | Below the median | “High output, optimized effort” |
| Heavy Hitters | High | High | “High output, high effort sustained” |
| Unengaged | Low | Low | “Low output, low effort” |
| Struggling | Low | High | “High effort but low recorded output” |
The table below lists everybody: Member, Quadrant, Output vs peak, Effort, Output.
Medians, not targets
Section titled “Medians, not targets”The medians are worked out from the rows the screen has loaded, so a month with three people in it produces a median of three people. Below about six, the four quadrants mean very little.
The label that needs care
Section titled “The label that needs care”“Struggling” is a harsh word for what the chart actually measures: high recorded effort, low recorded output. The usual causes are not the person.
- Their work does not produce tasks — support, meetings, review, mentoring
- Tasks exist but nobody is marking them done, which in this product only a manager can do
- They are blocked on somebody else
- They are carrying the work nobody logs
What it is good for
Section titled “What it is good for”Two honest uses.
Finding somebody quietly carrying the team. A high-output dot well left of the effort median is usually somebody whose way of working is worth copying — and who is not asking for credit.
Finding a measurement problem. A whole cluster in “Struggling” is not four struggling people. It is a team whose output is not being captured, and that is your problem to fix, not theirs.
What it does NOT include
Section titled “What it does NOT include”No export — no button and no report type behind it.
No date range beyond whole calendar months. Two month controls sit in the toolbar, a set of chips and a month box, and both set the same month.
No team filter. Whole workspace, so the medians are drawn across every role in it — which is why a workspace mixing support and delivery produces a chart that means less than it looks like it does.
No personal view. The person on the chart cannot see it.
It cannot see effort it does not record. A day of meetings away from the desk is low effort here.
What to do with what it shows
Section titled “What to do with what it shows”A dot in Smart Performers — ask them how they work, then tell the rest of the team.
A cluster in Struggling — look at the board before you look at the people.
A dot in Unengaged — check Activity first. Low effort and low output together is often a tracker that was not running.