Activity
Where did the hours go, and how much of them was active?
Activity (/reports/activity), titled “Productivity & activity” on screen.
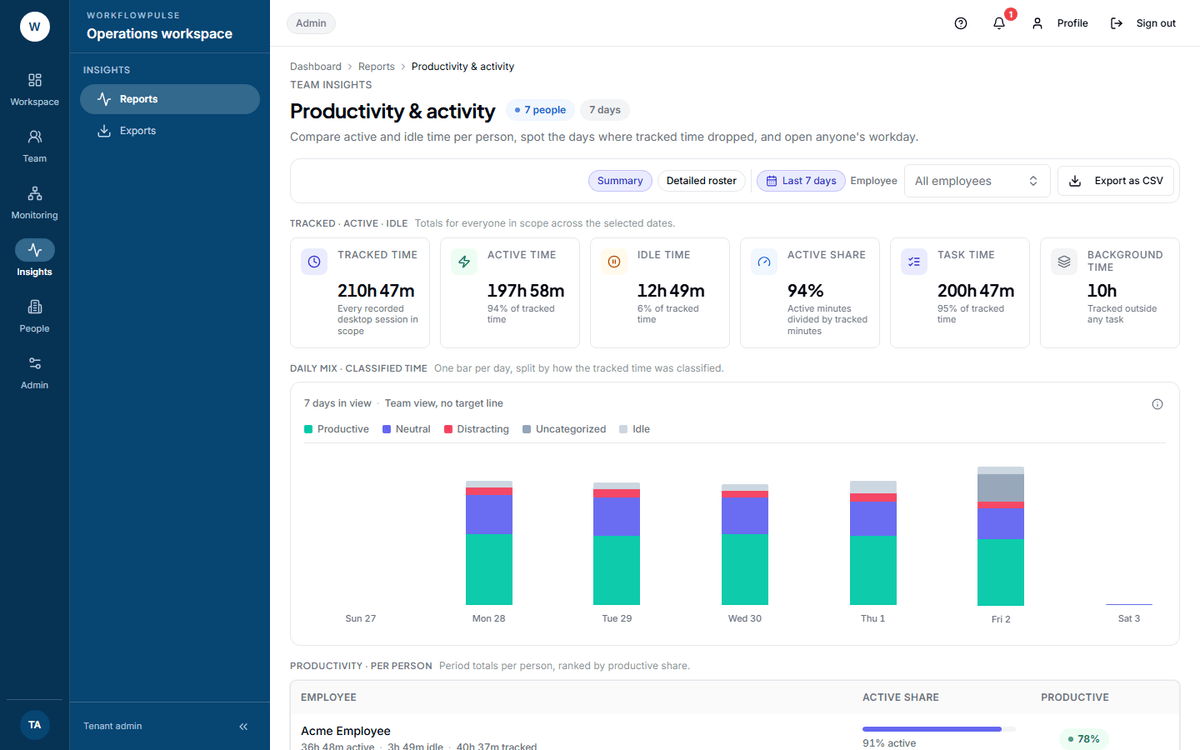 Start here, not on the chart. The people count in the bottom list is the first number to read, because a person missing from it has a broken tracker and every other figure on the page is short by their hours.
What question it answers
Section titled “What question it answers”Two questions, and the page changes its own subtitle depending on which one you are asking.
With nobody selected: “Compare active and idle time per person, spot the days where tracked time dropped, and open anyone’s workday.”
With one person selected: “Follow one person day by day.”
Where the numbers come from
Section titled “Where the numbers come from”Tracked time is every desktop session the tracker recorded. Idle comes from a separate stream of idle events, not from a gap in the sessions. Active is what is left when idle is taken off tracked — it is a subtraction, not its own measurement. The key and mouse counts are raw totals from the tracker.
The category split on the chart comes from your app rules, so it is only as good as they are.
The six tiles
Section titled “The six tiles”| Tile | What it is |
|---|---|
| Tracked time | Every recorded desktop session in scope |
| Active time | Tracked time with input, with its share of the total |
| Idle time | Tracked time without input |
| Active share | Active minutes divided by tracked minutes |
| Task time | Time booked straight to a task |
| Background time | Tracked, but not booked to a task |
Task time against Background time is the pair worth reading in a task-based workspace. A large background share means people are working without picking a task, and the project reports are missing exactly that much.
The chart
Section titled “The chart”Daily Mix · Classified Time — one bar per day, stacked into productive, neutral, distracting, uncategorized and idle.
The two views
Section titled “The two views”Summary lists each person with their active share and productive time. Short, and the right one for a weekly read.
Detailed roster adds idle time, the key and mouse counts, and a timeline strip for one chosen day — pick the day from the box in the toolbar. Ten people a page, with a pager underneath.
Every row has an icon that opens that person’s full day.
Coverage before performance
Section titled “Coverage before performance”Reading an active share honestly
Section titled “Reading an active share honestly”Active share is the proportion of tracked time with keyboard or mouse input. It is not a measure of thinking, reading or talking.
A person in meetings all day has a low active share and may have had the most useful day on the team. Somebody scrolling a spreadsheet has a high one.
Use it to find a person worth a conversation. Never as the conversation itself.
What it does NOT include
Section titled “What it does NOT include”No team filter. As with every report in the product.
No project or task grouping. Task time is a total, not a breakdown.
Idle is not a reason. The report records that input stopped. It cannot tell a meeting from a break from a long read, and neither can you from this screen — Timeline can.
Nothing here is approval-aware. Tracked is tracked.
Filters
Section titled “Filters”A date range, and in Summary an employee picker. That is all.
What to do with what it shows
Section titled “What to do with what it shows”Somebody missing from the list — their tracker is not running. Start there.
A day where the whole team’s bar is short — usually a holiday or an outage, not a performance event. Check the date before you ask anybody about it.
A large Background share — people are tracking without picking a task. Fix it on the board, not on this screen.
One person with a low active share — open their Timeline before forming a view. It takes a minute and it is usually a different story.
Export
Section titled “Export”Export as CSV sends an active_vs_idle request and moves you to Exports. The current employee filter travels with it.
Next: App and website use · Timeline