App and website use
Which applications and sites took the team’s time?
App and website use (/reports/app-usage), titled “Apps & URLs” on screen.
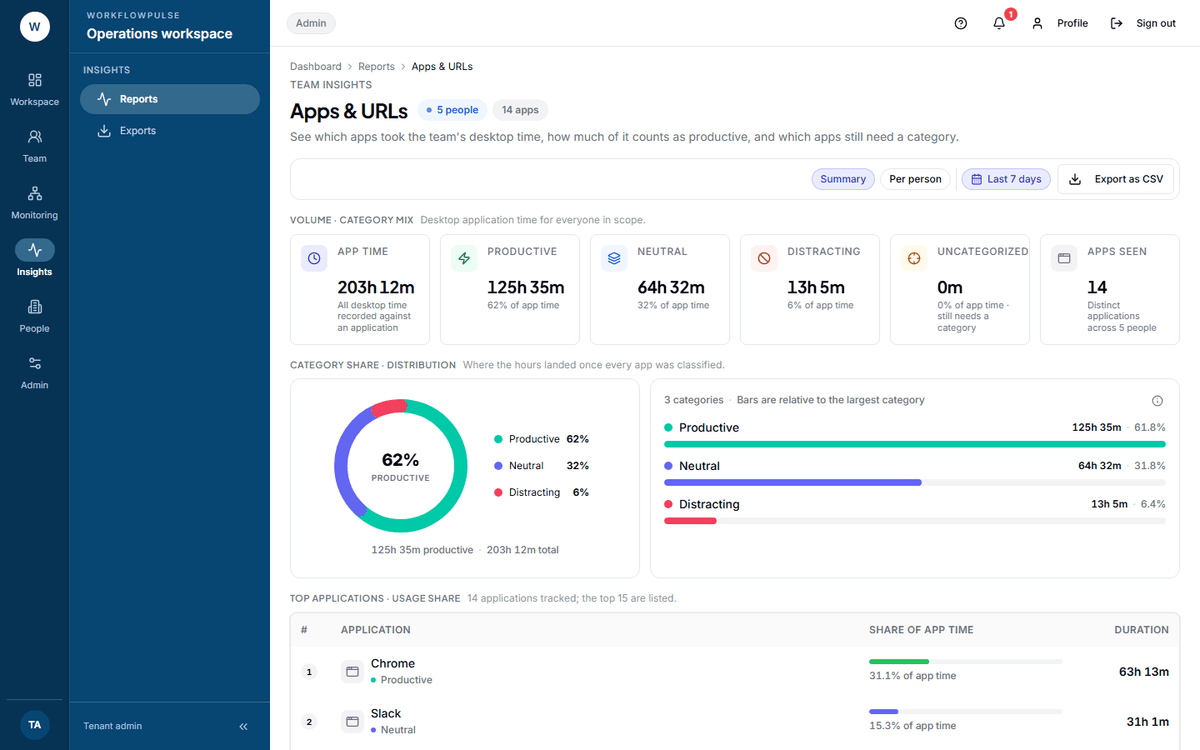 Read the fifth tile before any of the others. Uncategorized is the amount of time your rules could not score, and it sets the error bar on every productivity percentage in the product.
What question it answers
Section titled “What question it answers”Where the team’s desktop hours went, by application — and, more usefully, how much of that time your rules could not classify at all.
Where the numbers come from
Section titled “Where the numbers come from”The tracker records an event every time the active application changes. Those events are summed per app, then each app is scored against your rules — the person’s productivity role first, then a team rule, then a workspace rule, then the built-in defaults. Anything that matches none of the four is Uncategorized.
So this report is a measurement of your tracker and of your rule set, in one screen.
The figure that matters most
Section titled “The figure that matters most”The other five tiles are App time, Productive, Neutral, Distracting and Apps seen.
Reducing it
Section titled “Reducing it”The summary table lists applications by time with their share and duration.
For each one, decide which job it belongs to and classify it there — not workspace-wide. A company-wide rule to fix one team’s tool is how a rule set becomes unmaintainable. See Apps and websites.
Doing this once in the first fortnight is the highest-value hour an admin spends on the product.
The two views
Section titled “The two views”Summary — a category donut, a bar per category, and a numbered table of applications with their share and duration.
Per person — one panel per person with their own category split and their own application list.
What it does NOT include
Section titled “What it does NOT include”Only the top fifteen applications are listed. The table caption says how many were tracked, then shows fifteen. There is no page two and no sort control — the long tail is not reachable from this screen. Use the export when you need it.
No team filter, and no project or task breakdown.
No window titles. The tracker can record them, and the Application Log on Timeline shows them. This report groups by application only.
What to do with what it shows
Section titled “What to do with what it shows”Uncategorized above 10% — work down the table and classify. This is the whole job of this screen.
A distracting app near the top is a rules question before it is a people question. Check it in the categorisation tester first: the tool on Apps and websites names which of the four layers decided it, in five seconds.
An unfamiliar application with real hours against it is worth asking about. It is often a tool a team adopted that nobody told you about — and a rule you now need.
Export
Section titled “Export”Export as CSV sends an app_usage_breakdown request.
Next: Apps and websites · Activity